


New Congress Was Sworn in Jan. 3, 2019
March 27, 2019 – Since the new Congress was sworn in on Jan. 3 and the midterm elections in November, interest in the U.S. Census Bureau’s My Congressional District (My CD) tool has remained high.
My CD gives users quick and easy access to selected statistics collected by the Census Bureau through the American Community Survey (ACS) and County Business Patterns (CBP).
The ACS provides detailed demographic, social, economic and housing statistics updated each year for the nation's communities. CBP provides annual statistics for businesses with paid employees at a detailed geography and industry level.
While the tool is often used by congressional staff on Capitol Hill for planning and managing constituent outreach, campaigns seeking Congressional office make use of it as well. Others, such as media, use it for research and articles.
Midterm Elections
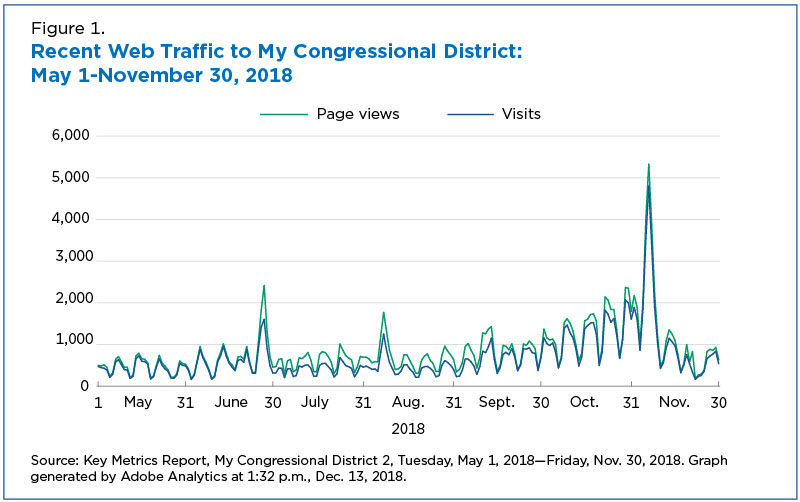
During the run-up to the recent midterm elections, there were 10,000-20,000 page views a week of the My CD tool embedded on other sites in comparison to a typical level of around 4,000 page views during nonelection times.
“A lot of the people who see My CD on the web are seeing it embedded on other sites,” said Francine Krasowska, Customer Experience Analyst at the Census Bureau. “At times, the embedded widget gets more page views than the version on census.gov.”
On census.gov, My CD saw nearly 20,000 page views during election week, with over 5,000 on Election Day. The 20,000 views were nearly four times the typical weekly traffic this past summer. By comparison, in 2017, the tool averaged under 2,000 views a week to a peak of nearly 6,000 page views during the primaries.
 |
In the 30 days leading up to the midterm elections last November, districts in California, Minnesota, New York and Texas were among the most heavily looked at on My CD. On Election Day, districts in New York and Ohio pulled in the most page views.
“It is very exciting to see the spike in visits to My Congressional District around an election,” said Christina Stoehr, program analyst in the Web and New Media Branch at the Census Bureau. “It lets us know that the application is a useful tool and users rely on it for relevant data.”
My Tribal Area
Much like My CD, the Census Bureau launched My Tribal Area in 2017. It provides comprehensive maps, data profiles and downloadable features for each tribal area. Users can also share a link to the application on social media or generate an embed code to include the tool on their own website.
Last November, two American Indian women made history when they became the first to be elected to Congress (Sharice Davids of New Mexico and Deb Haaland of Kansas).
Redistricting Tool
As we lead up to the 2020 Census, our 2020 Census Redistricting Data Program provides states the opportunity to delineate voting districts and to suggest census block boundaries for use in the 2020 Census redistricting data tabulations (Public Law 94-171 Redistricting Data File).
The tool will be updated later this year for the 116th Congress and the latest ACS data, including new redistricting data for states such as Pennsylvania, Colorado and Minnesota.